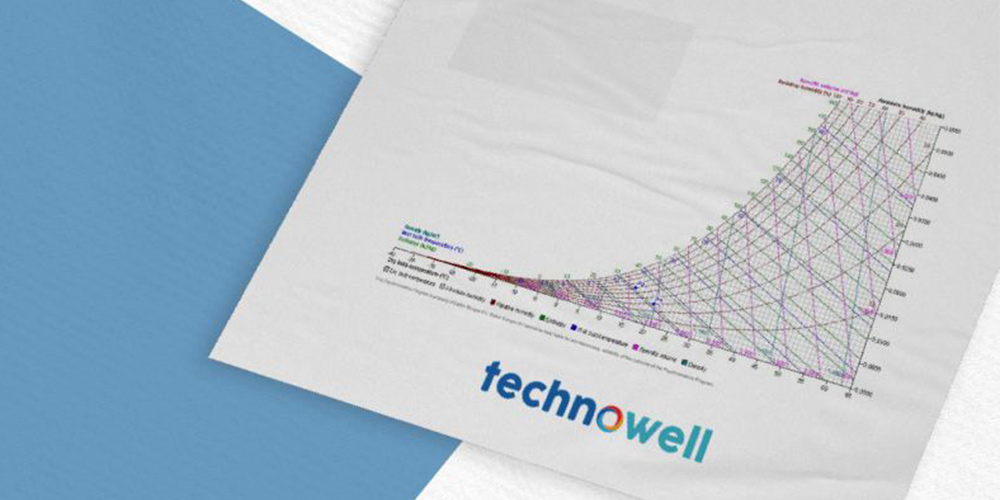


What is a Psychrometric Diagram?
Psychrometric diagrams are tools that graphically represent the relationships between air's humidity levels and temperature. These diagrams plot relative humidity (%), dry bulb temperature / wet bulb temperature (°C), air density, and other thermodynamic properties on a graph.
Relative humidity is the ratio of the amount of water vapor in the air to the maximum amount of water vapor the air can hold at that temperature. In a psychrometric diagram, absolute humidity is represented on the vertical axis, while dry bulb temperature values are shown on the horizontal axis.
Psychrometric diagrams are used to analyze how air behaves under various conditions. For example, they can determine the maximum amount of moisture the air can hold at a given temperature or calculate the new humidity and temperature values when air is heated or cooled.
Humidity control is crucial in many areas, including building climate control, agriculture, food industry, and HVAC systems. Psychrometric diagrams are an essential tool for understanding and managing air's humidity levels in these fields, ensuring indoor comfort, optimizing storage and processing of products, and enhancing energy efficiency.